Discover how the Chop Zone Indicator boosts trading accuracy by identifying trends and choppy zones. Learn tips and strategies to succeed!

Introduction to the Chop Zone Indicator: Measure Market Choppiness or Trend Strength
The Chop Zone Indicator is a powerful technical analysis tool that identifies whether a market is trending or ranging. Unlike trend-following indicators, this tool quantifies “choppiness,” helping traders avoid uncertain market conditions. Its primary purpose is to help you determine when to stay out of the market and when to capitalize on trends.
Understanding the Chop Zone Indicator is crucial for traders. Market conditions constantly shift between trending and choppy phases. This indicator reduces guesswork, enabling informed decisions. By filtering out noise during sideways movements, it minimizes unnecessary trades and protects your capital.
Whether you’re an intraday, swing, or long-term trader, mastering this tool will improve your strategy. It provides clarity, helping you focus on markets with higher profit potential.
For an in-depth overview of technical indicators, visit Investopedia’s Technical Analysis Basics.
Why the Chop Zone Indicator Matters for Traders
- Filter Out Choppy Markets: Avoid trading in uncertain, low-probability conditions.
- Optimize Entry and Exit Points: Use it to time trades more effectively.
- Improve Risk Management: Reduce overtrading and protect against unnecessary losses.
This understanding is essential for developing confidence and maintaining discipline in volatile markets.
![OnePlus [CPS] Many Geos](data:image/svg+xml;base64,PHN2ZyB4bWxucz0iaHR0cDovL3d3dy53My5vcmcvMjAwMC9zdmciIHdpZHRoPSI3MjgiIGhlaWdodD0iOTAiIHZpZXdCb3g9IjAgMCA3MjggOTAiPjxyZWN0IHdpZHRoPSIxMDAlIiBoZWlnaHQ9IjEwMCUiIHN0eWxlPSJmaWxsOiNjZmQ0ZGI7ZmlsbC1vcGFjaXR5OiAwLjE7Ii8+PC9zdmc+)

Understanding the Chop Zone Indicator: What Every Trader Needs to Know
What Is the Chop Zone Indicator? Definition and Overview
The Chop Zone Indicator is a technical analysis tool that determines whether a market is choppy or trending. It helps traders identify consolidation phases, where price movement lacks direction, or trending phases, where clear momentum exists. Unlike trend-following indicators, this tool highlights periods of indecision.
Traders rely on this indicator to recognize when to trade actively and when to stay out. It works on any timeframe, making it versatile for all trading styles.
For more insights on choppiness indicators, check out this guide on choppy markets.
Key Features of the Chop Zone Indicator: Measuring Choppiness or Trend Strength
The indicator assigns numerical values to market movement. Higher values signify a choppy market, while lower values suggest trending conditions.
- Choppiness Measurement: Helps traders avoid unpredictable markets.
- Trend Identification: Highlights when clear trends begin.
- Versatility: Effective for forex, stocks, crypto, or commodities.
Historical Context: Origins and Comparison to Similar Tools
The Chop Zone Indicator is based on volatility and directional movement. It builds upon concepts from the Average True Range (ATR) and Directional Index. Unlike the Average Directional Index (ADX), which measures trend strength, the Chop Zone focuses on determining trend absence.
Why Do Traders Use the Chop Zone Indicator? Key Benefits
- Avoid False Signals: Helps filter out trades during low-probability phases.
- Enhance Timing: Identifies when trends start or end.
- Improve Risk Management: Reduces unnecessary losses in sideways markets.
By incorporating this tool into your strategy, you can focus on high-quality trades and improve overall profitability.

Formula for the Chop Zone Indicator: Breaking Down the Components
Chop Zone Indicator Formula: Key Components and Explanation
The Chop Zone Indicator formula is designed to measure market choppiness. It is calculated using volatility and directional movement:
- ATR Sum (n): The sum of the Average True Range over a specified period nnn. ATR measures volatility by considering high-low ranges.
- Range (n): The difference between the highest high and lowest low over the same period nnn.
- Logarithmic Scale: Logarithm normalizes the values, keeping the indicator in a standard range.
This formula outputs a value, often between 0 and 100. Higher values (e.g., above 60) indicate a choppy market, while lower values (e.g., below 40) suggest trending conditions.
For further reading on ATR and its role in technical analysis, visit Investopedia’s guide on Average True Range.
Example: Calculating the Chop Zone Indicator
Imagine a 14-period Chop Zone Indicator:
- The ATR Sum over 14 periods is 14.5.
- The Range (highest high – lowest low) is 10.2.
Using the formula:
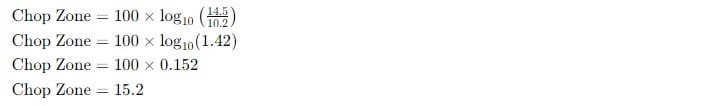
- This value (15.2) signals a trending market.
Relationship with ATR and Directional Movement Indicators
The Chop Zone builds upon the Average True Range (ATR) and directional movement concepts.
- ATR measures market volatility, a key input for the Chop Zone formula.
- Directional Movement highlights trends, complementing the Chop Zone’s focus on trend absence.
- Comparison with ADX: While ADX emphasizes trend strength, Chop Zone identifies periods where trends are absent.
By integrating ATR and Chop Zone, traders get a clearer picture of both volatility and market direction, enabling smarter decisions.

When and How to Use the Chop Zone Indicator: Maximizing Its Potential
Suitable Market Conditions: Trending vs. Ranging Markets
The Chop Zone Indicator helps identify whether the market is trending or ranging.
- Trending Markets: When the Chop Zone value is low (e.g., below 40), the market is likely trending. In this phase, traders can follow momentum strategies to capture large moves.
- Ranging Markets: High Chop Zone values (e.g., above 60) signal a choppy, sideways market. During this phase, it’s better to avoid directional trades or use range-bound strategies like buying near support and selling near resistance.
Knowing the market condition helps traders choose the right strategies and avoid unnecessary losses.
Recommended Timeframes for Different Trading Styles
The Chop Zone Indicator works on all timeframes, making it versatile for various trading styles.
- Intraday Traders: Use shorter timeframes like 5 or 15 minutes to identify quick market shifts.
- Swing Traders: Opt for daily or 4-hour charts to capture medium-term trends and avoid consolidation periods.
- Long-Term Traders: Weekly charts help spot sustained trends and avoid unnecessary noise.
Each timeframe adjusts the indicator’s sensitivity, so align it with your trading objectives.
Combining the Chop Zone with Other Indicators for Better Accuracy
- Moving Averages for Trend Direction: Use a moving average (e.g., 50 EMA) to confirm the market’s trend direction during low Chop Zone values.
- RSI or Stochastic Oscillator for Overbought/Oversold Levels: When the Chop Zone indicates a range, use RSI or Stochastic to identify potential reversal points.
- Support and Resistance Levels for Context: Overlay support and resistance zones to determine critical price levels during choppy conditions. These levels act as entry and exit points.
For additional technical analysis strategies, visit BabyPips’ guide on indicators.
By tailoring the Chop Zone Indicator to your trading style and combining it with other tools, you’ll improve decision-making and maximize profits.

Can the Chop Zone Indicator Be Used Alone? Exploring Its Effectiveness
Scenarios Where the Chop Zone Indicator Works on Its Own
The Chop Zone Indicator can be used alone in specific market scenarios.
- High-Volume Markets: In markets with significant trading activity, such as forex or major stock indices, the Chop Zone Indicator effectively highlights periods of consolidation and trending movement.
- Simple Market Analysis: For traders who want a straightforward approach, the Chop Zone can provide clear signals on whether to trade or wait.
- Short-Term Scalping: In intraday trading, the indicator can be sufficient for identifying quick opportunities in trending markets.
However, relying solely on the Chop Zone works best when market conditions are stable and predictable.
Limitations of Using the Chop Zone Indicator Alone
While useful, the Chop Zone Indicator has limitations when used without additional tools:
- Susceptible to False Signals: In volatile or low-volume markets, the indicator may produce misleading values, leading to incorrect trades.
- Lack of Directional Confirmation: It identifies choppiness but doesn’t confirm the market’s direction or momentum.
- Reduced Effectiveness in Complex Markets: In highly manipulated or news-driven markets, relying on this tool alone can result in suboptimal decisions.
For these reasons, traders should consider its limitations before using it as a standalone strategy.
Enhancing Accuracy with Complementary Indicators
Combining the Chop Zone Indicator with other tools enhances its reliability:
- Trend Confirmation: Use moving averages or the ADX to verify market direction during low Chop Zone values.
- Volume Analysis: Add volume indicators to identify the strength of a trend or breakout during transitions from choppy to trending markets.
- Volatility Tools: Pair the Chop Zone with Bollinger Bands or ATR to assess price movements and potential breakout zones.
For detailed guidance on combining indicators, explore this article on technical analysis tools.
By integrating the Chop Zone with complementary indicators, you improve trade accuracy and confidence in your decisions.

Step-by-Step Guide to Trade with the Chop Zone Indicator
Step 1: Determine Market Condition – Trending or Ranging
The first step in using the Chop Zone Indicator is to identify the current market condition.
- Trending Market: When the Chop Zone value is below 40, the market is likely trending. Prepare to trade in the direction of the trend.
- Ranging Market: Values above 60 indicate a choppy or sideways market. Avoid taking directional trades during these periods.
Knowing the market condition ensures that your strategy aligns with the phase of price movement.
Step 2: Set Up the Chop Zone Indicator on Your Chart
To use the Chop Zone Indicator, load it on your charting platform. Platforms like TradingView or MetaTrader support this indicator.
- Choose the desired timeframe based on your trading style (e.g., 15 minutes for intraday or daily for swing trading).
- Configure the indicator settings, such as the lookback period (commonly 14 or 21).
Ensure your settings match your trading strategy for optimal performance.
Step 3: Identify Chop Zones Based on Threshold Values
Analyze the indicator’s values to pinpoint key zones:
- High Chop Zone Values (Above 60): Indicates a lack of trend and high choppiness. Avoid trading during these phases.
- Low Chop Zone Values (Below 40): Signals trending conditions. Look for entry opportunities aligned with the trend direction.
These thresholds provide clarity on whether to trade or wait.
Step 4: Use Signals to Avoid Trades or Spot Breakout Opportunities
When the Chop Zone value transitions from high to low, it signals a potential breakout.
- Breakout Preparation: Monitor the market closely during these transitions. Look for confirmation from other tools like volume or price action.
- Avoidance Signal: Remain on the sidelines during persistent high Chop Zone values to reduce unnecessary trades.
For breakout strategies, visit this guide on trading breakouts.
Step 5: Place Trades with Confirmed Signals
Once the market condition and breakout signals are clear, take action:
- Entry Points: Align entries with the trend direction during low Chop Zone values.
- Stop-Loss Placement: Place stops beyond support or resistance levels to minimize risk.
- Exit Strategy: Use trailing stops or fixed profit targets to secure gains.
Always apply proper risk management and avoid overleveraging your position.
By following these steps, you can effectively incorporate the Chop Zone Indicator into your trading strategy and improve results.

Example for Using the Chop Zone Indicator in Trading
Example 1: Sideways Market and Choppy Phase
Imagine a forex pair like EUR/USD on a 1-hour chart. The Chop Zone value consistently stays above 60, indicating a choppy market. Price moves between 1.1000 and 1.1050, failing to break out.
- Indicator Signal: High Chop Zone values confirm a range-bound market with low trade potential.
- Action to Take: Avoid entering trades. Instead, wait for the Chop Zone value to drop below 40, signaling the end of choppiness.
This saves you from entering low-probability trades and risking unnecessary losses.
Example 2: Bullish Trend Following a Breakout
On a 4-hour BTC/USD chart, the price consolidates between $30,000 and $31,000 with high Chop Zone values. Suddenly, price breaks above $31,000, and the Chop Zone value drops below 40.
- Indicator Signal: The declining Chop Zone value signals a trending phase after the breakout.
- Action to Take: Enter a long trade aligned with the trend. Set a stop-loss below $31,000 and use a trailing stop to capture gains.
This approach helps you capitalize on strong upward momentum.
Example 3: Bearish Trend Reversal in a Stock
Consider Tesla (TSLA) on a daily chart. The price forms a double top near $300, and the Chop Zone value transitions from high to low. A break below $280 confirms a bearish reversal.
- Indicator Signal: The Chop Zone drops below 40, confirming the trend shift.
- Action to Take: Enter a short position after the price breaks support. Place a stop-loss above $280 and target the next support level.
This setup highlights how the indicator can assist in identifying reversal opportunities.
Example 4: Prolonged Range-Bound Market
A currency pair like USD/JPY trades sideways for weeks between 145.00 and 146.50. The Chop Zone value remains above 60 throughout this period.
- Indicator Signal: Persistently high Chop Zone values confirm a prolonged range-bound market.
- Action to Take: Use mean-reversion strategies, such as buying at support (145.00) and selling at resistance (146.50). Avoid trend-following strategies.
By analyzing varying conditions with the Chop Zone Indicator, you can adapt your approach to suit market behavior. For more trading examples, check out this resource on practical strategies.

When Can You Turn a Profit with the Chop Zone Indicator?
Market Conditions: Profitability in Trending vs. Choppy Markets
The Chop Zone Indicator is most profitable when aligned with favorable market conditions.
- Trending Markets: In trending conditions, indicated by Chop Zone values below 40, traders can capitalize on directional price moves.
- Choppy Markets: High Chop Zone values (above 60) signal a sideways market, where profitability diminishes due to false signals.
Focusing on trending markets and avoiding trades in choppy zones ensures better profitability over time.
Risk-Reward Ratio and Disciplined Execution
Profitability also depends on maintaining a favorable risk-reward ratio and disciplined trade management.
- Risk-Reward Ratio: Aim for at least a 1:2 risk-reward ratio, risking $1 to make $2.
- Disciplined Execution: Stick to your strategy and avoid impulsive trades, even when the Chop Zone suggests potential opportunities.
By managing risks effectively, you protect your capital and maximize returns during favorable conditions.
Combining Chop Zone with Other Indicators for Accuracy
The Chop Zone Indicator becomes more reliable when used with complementary tools:
- Trend Indicators: Use moving averages or ADX to confirm market direction during low Chop Zone values.
- Momentum Tools: Pair with RSI or MACD to identify entry points with added confidence.
- Volume Analysis: Incorporate volume indicators to validate breakout strength when transitioning from high to low Chop Zone values.
Combining indicators reduces false signals and increases trade accuracy. Explore this guide on indicator synergy.
Practical Advice: Avoid Overtrading in Choppy Zones
Overtrading in high Chop Zone conditions can lead to unnecessary losses.
- Wait for Clear Signals: Avoid trades during prolonged sideways movement. Look for trends or breakouts instead.
- Preserve Capital: Stay patient and focus on high-probability setups during low Chop Zone values.
By understanding market conditions and executing trades with discipline, the Chop Zone Indicator can help you achieve consistent profits.

Backtesting and Optimization: Maximizing the Chop Zone Indicator's Effectiveness
How to Backtest the Chop Zone Indicator on Historical Data
Backtesting ensures the Chop Zone Indicator performs effectively under different market conditions.
- Step 1: Collect Data: Obtain historical price data for your preferred asset and timeframe. Use platforms like TradingView or MetaTrader.
- Step 2: Apply the Indicator: Add the Chop Zone Indicator to the chart. Set default or custom parameters (e.g., 14-period).
- Step 3: Simulate Trades: Analyze the indicator’s values (high for choppy, low for trending). Record entry, exit, and stop-loss levels for simulated trades.
- Step 4: Evaluate Results: Review performance metrics like win rate, average profit/loss, and maximum drawdown.
Regular backtesting refines your strategy and builds confidence in real-time applications. Learn more about backtesting here.
Tips for Optimizing Chop Zone Indicator Settings
Optimizing the Chop Zone Indicator improves its accuracy for specific markets or trading styles.
- Adjust Lookback Period: Shorter periods (e.g., 10) are ideal for fast-moving markets. Longer periods (e.g., 21) suit swing trading.
- Market-Specific Calibration: Test different settings for forex, stocks, or commodities to find the most responsive configuration.
- Combine with Other Indicators: Use tools like moving averages or ATR to enhance decision-making during low Chop Zone values.
Optimization ensures the indicator aligns with your trading goals and market behavior.
Evaluating the Indicator’s Impact on Profitability
Assessing the Chop Zone’s impact on profitability helps identify its strengths and weaknesses.
- Analyze Key Metrics: Compare returns with and without the Chop Zone. Focus on risk-adjusted metrics like Sharpe ratio or profit factor.
- Measure Accuracy: Calculate how often the indicator correctly identifies choppy or trending conditions.
- Long-Term Testing: Backtest over multiple years and market cycles to ensure consistent results.
A well-optimized Chop Zone Indicator can significantly enhance your trading performance. For advanced optimization techniques, check out this trading guide.

Psychological Benefits of Using the Chop Zone Indicator
Avoid Emotional Decisions in Uncertain Markets
The Chop Zone Indicator serves as a reliable tool to reduce emotional trading during uncertain phases.
- Clarity in Choppy Markets: When the Chop Zone value is above 60, it confirms market indecision, helping traders avoid impulsive trades.
- Data-Driven Decisions: By relying on the indicator, you can eliminate guesswork and base decisions on objective analysis.
This prevents overtrading or chasing losses during unpredictable price movements. For tips on managing trading psychology, visit this guide.
Encourages Patience by Identifying Non-Trading Zones
Patience is crucial in trading, and the Chop Zone Indicator reinforces this discipline.
- Wait for Trends: High Chop Zone values signal to wait for better opportunities when the market is trending.
- Focus on Quality Trades: By avoiding trades during choppy conditions, traders conserve capital for high-probability setups.
This patience minimizes unnecessary risks and helps traders achieve consistent profitability over time.
Incorporating the Chop Zone Indicator into your strategy can positively impact trading psychology by reducing emotional reactions and encouraging disciplined actions.

Frequently Asked Questions About the Chop Zone Indicator
What is the Chop Zone Indicator Used For?
The Chop Zone Indicator measures market choppiness and helps identify trending versus ranging conditions.
- Purpose: It highlights non-trading zones, reducing the risk of false signals in sideways markets.
- Application: Traders use it to decide whether to trade or wait for better market conditions.
This tool is essential for filtering noise during market indecision. Learn more about its application here.
Can the Chop Zone Indicator Be Used Alone?
While it can work alone, combining it with other tools improves accuracy.
- Limitations: It may produce false signals, especially in volatile conditions without clear trends.
- Recommendation: Use it with trend-following indicators like moving averages or momentum tools like RSI for better results.
Enhancing the indicator with complementary tools increases confidence in your trades.
Which Timeframe Works Best with the Chop Zone Indicator?
The best timeframe depends on your trading style.
- Intraday Traders: Use shorter timeframes like 5 or 15 minutes to spot quick shifts in market conditions.
- Swing Traders: Opt for longer timeframes, such as 4-hour or daily charts, for identifying broader trends.
Testing different timeframes ensures the indicator aligns with your trading goals.
What Are the Ideal Settings for the Chop Zone Indicator?
Default settings typically work well, but adjustments may be needed for specific markets.
- Lookback Periods: Shorter periods (e.g., 10) suit fast-moving assets. Longer periods (e.g., 21) provide smoother signals.
- Market-Specific Optimization: Test various settings on forex, stocks, or crypto to maximize effectiveness.
Regular optimization ensures the indicator adapts to changing market conditions.
How Does the Chop Zone Compare to Other Indicators?
The Chop Zone focuses on market choppiness, while other tools have different objectives.
- Trend Indicators: Moving averages confirm market direction, complementing the Chop Zone’s range identification.
- Volatility Indicators: ATR measures price movement, adding context to the Chop Zone’s signals.
Combining multiple indicators provides a well-rounded analysis for better decision-making.
For additional insights, explore this resource on technical indicators.

Conclusion: The Chop Zone Indicator’s Value in Trading
A Vital Tool for Identifying Market Conditions
The Chop Zone Indicator is an essential tool for traders aiming to navigate choppy and trending markets effectively.
- Choppy Markets: It highlights non-trading zones, preventing impulsive trades during uncertain phases.
- Trending Markets: By identifying low choppiness, it signals potential trends, enabling traders to focus on high-probability setups.
Incorporating this indicator helps traders make informed decisions and avoid costly mistakes.
Enhancing Success with Complementary Tools
While powerful, the Chop Zone Indicator works best when paired with other tools.
- Combination Benefits: Trend indicators, momentum oscillators, and volume analysis improve its accuracy and reliability.
- Customized Strategy: Adapting these tools to your trading style and market improves your overall performance.
A well-rounded strategy ensures long-term consistency and profitability. Learn how to create a strategy here.
Practice Makes Perfect: Start on a Demo Account
To master the Chop Zone Indicator, practice extensively in a risk-free environment.
- Demo Trading: Use demo accounts to understand the indicator’s behavior and refine your approach.
- Build Confidence: Testing strategies in real-time market conditions enhances your confidence for live trading.
Start practicing today and turn your trading into a consistent, disciplined endeavor.
Terms and Conditions
Educational Purpose
The content provided in this article is intended for informational and educational purposes only. It does not constitute financial, investment, or trading advice.
Learn how to use the Chande Momentum Oscillator for identifying trends, reversals, and overbought/oversold levels with actionable tips.