
Learn how the Fourier Transform Indicator detects cycles, reduces noise, and refines trading strategies for market success.

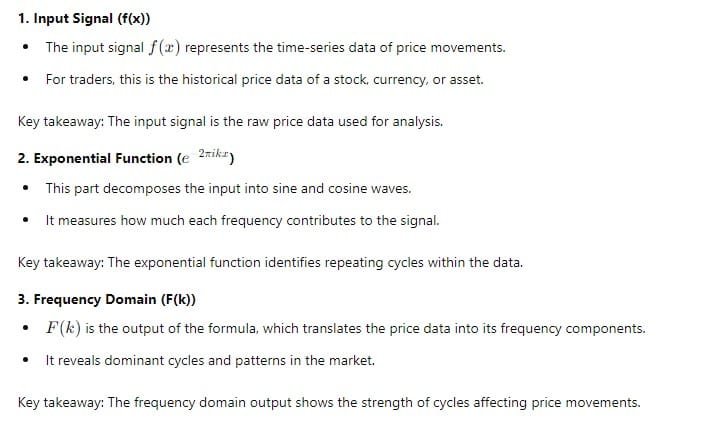
Understanding the Fourier Transform Indicator
The Fourier Transform Indicator is a technical analysis tool derived from signal processing concepts. It helps traders analyze price patterns by breaking them into simpler, periodic components. This approach allows for better identification of cycles and trends hidden within market noise.
What is Fourier Transform in Signal Processing?
The Fourier Transform is a mathematical operation that converts a signal from its original domain (time) to the frequency domain. In trading, this means transforming price movements into their frequency equivalents to reveal underlying periodicities.
For example, a Fourier Transform can highlight repetitive patterns in stock prices, making it easier to anticipate market behaviors.
Key takeaway: Fourier Transform translates complex data into manageable frequency components to enhance analysis precision.
Applications of Fourier Transform in Technical Analysis
Converting Price Data into Frequency Components
Market prices fluctuate in complex patterns, often obscuring cyclic trends. By applying Fourier Transform, traders break these movements into simpler oscillations.
This process uncovers the dominant cycles influencing price action, such as monthly, weekly, or daily trends. For instance, a 30-day cycle might suggest recurring buying or selling activity every month.
Key takeaway: Identifying dominant cycles helps traders anticipate recurring patterns for more informed decisions.
Filtering Market Noise for Clearer Signals
Price data contains significant noise—random fluctuations caused by unpredictable events or low-volume trades. Fourier Transform filters out this noise, isolating the core cyclical behavior.
By removing irrelevant fluctuations, traders gain a clearer view of price trends, enabling more accurate strategy development.
Key takeaway: Filtering market noise improves clarity and precision in trend analysis.
Why Use the Fourier Transform Indicator?
- Cycle Detection: Identifies repeating patterns to predict market reversals or continuations.
- Noise Reduction: Removes distracting fluctuations, leaving actionable data.
- Enhanced Analysis: Breaks complex signals into simpler, interpretable components.
Note: The Fourier Transform Indicator excels in markets with cyclic behaviors. However, it may underperform in trending markets without clear cycles.
For further insights on Fourier Transform and its role in trading, refer to this comprehensive guide on Fourier Transform in Technical Analysis.
![OnePlus [CPS] Many Geos](data:image/svg+xml;base64,PHN2ZyB4bWxucz0iaHR0cDovL3d3dy53My5vcmcvMjAwMC9zdmciIHdpZHRoPSI3MjgiIGhlaWdodD0iOTAiIHZpZXdCb3g9IjAgMCA3MjggOTAiPjxyZWN0IHdpZHRoPSIxMDAlIiBoZWlnaHQ9IjEwMCUiIHN0eWxlPSJmaWxsOiNjZmQ0ZGI7ZmlsbC1vcGFjaXR5OiAwLjE7Ii8+PC9zdmc+)

Formula for the Fourier Transform Indicator
The Fourier Transform Indicator relies on a mathematical formula to analyze market price patterns. It converts price data from the time domain into the frequency domain, revealing dominant cycles and periodic trends.
Understanding the Fourier Transform Formula
The formula for Fourier Transform is:

This equation might seem complex, but breaking it into parts simplifies its meaning and application.
Simplified Interpretation for Traders
What Does the Formula Achieve Practically?
The Fourier Transform formula highlights recurring cycles in price data. It identifies which patterns dominate and filters out irrelevant noise.
For instance, traders can spot a recurring 20-day cycle in a stock’s price movements. This insight helps them time their trades based on historical behavior.
Key takeaway: The Fourier Transform extracts meaningful patterns to assist in decision-making.
Key Insights Traders Derive from the Output
- Cycle Strength and Duration:
- Dominant cycles indicate how long patterns last and their intensity.
- Noise Filtering:
- Removes irrelevant fluctuations for a clearer market perspective.
- Market Structure Analysis:
- Uncovers hidden relationships in price movements.
Note: To gain maximum benefit, traders should combine Fourier Transform insights with other tools.
For a detailed explanation of Fourier Transform in trading, check this resource on Fourier Transform applications.

When and How to Use the Fourier Transform Indicator
The Fourier Transform Indicator is a powerful tool for analyzing market cycles and filtering noise. Knowing when and how to use it effectively can improve your trading strategies and decision-making.
When to Use the Fourier Transform Indicator
1. Cyclical Markets or Mean-Reverting Behavior
The Fourier Transform Indicator excels in markets where prices follow cyclical or oscillatory patterns. For example, it can highlight a recurring 30-day cycle in stock prices.
This makes it particularly useful in ranging markets or assets with seasonal tendencies. In contrast, it may underperform in strongly trending markets.
Key takeaway: Use the Fourier Transform when the market shows repetitive patterns or mean-reverting trends.
2. Identifying Noise and Random Fluctuations
Markets often experience noise caused by low-volume trades or unpredictable events. Fourier Transform helps traders isolate these random fluctuations.
By filtering out irrelevant noise, it ensures that traders focus only on actionable data and dominant price cycles.
Key takeaway: Apply this tool to remove noise and gain a clearer view of market cycles.
How to Use the Fourier Transform Indicator
1. Steps to Apply Fourier Transform on Price Data
- Step 1: Gather historical price data for the asset you want to analyze.
- Step 2: Use software or trading platforms with Fourier Transform capabilities to process the data.
- Step 3: Identify dominant cycles and their durations based on the output.
Key takeaway: Follow a structured approach to extract actionable insights from the Fourier Transform.
2. Adjusting Parameters for Different Timeframes
- Intraday Trading: Focus on shorter cycles, such as hourly or daily fluctuations.
- Swing Trading: Analyze medium-term cycles, often spanning days or weeks.
- Position Trading: Concentrate on longer-term cycles like monthly or yearly trends.
Adjusting parameters ensures the Fourier Transform output aligns with your trading strategy and timeframe.
Key takeaway: Tailor the indicator’s settings to suit your trading style and timeframe.
Why Use the Fourier Transform Indicator?
- Cycle Detection: Identifies repeating patterns to predict market reversals or continuations.
- Noise Reduction: Removes distracting fluctuations, leaving actionable data.
- Enhanced Analysis: Breaks complex signals into simpler, interpretable components.
Pro Tip for Combining Fourier Transform with Other Tools
The Fourier Transform Indicator is most effective when combined with complementary tools like RSI, MACD, or Bollinger Bands. This confirms signals and reduces false positives.
For additional insights, explore this in-depth guide to market cycle analysis.
Let me know if you’d like further refinements!

Can the Fourier Transform Indicator Be Used Alone?
The Fourier Transform Indicator is a robust tool for analyzing market cycles, but like any technical analysis tool, it has its strengths and limitations. Understanding when and how it can be used alone is essential for effective trading.
Advantages of Using the Fourier Transform Indicator Alone
1. Reduces Market Noise for Clearer Insights
The Fourier Transform Indicator is highly effective at filtering out random price fluctuations or market noise. By isolating dominant cycles, it provides a cleaner view of price behavior.
This feature makes it valuable for traders looking to focus on actionable patterns without being distracted by short-term volatility.
Key takeaway: Noise reduction simplifies analysis, making patterns and trends easier to interpret.
2. Detects Dominant Frequencies Without Additional Tools
Unlike many indicators, the Fourier Transform can identify the most influential cycles within the market on its own. This eliminates the immediate need for combining it with other tools.
For example, traders can use it to pinpoint recurring 20-day or 50-day price patterns for timing entries and exits.
Key takeaway: Dominant frequency detection provides actionable insights without relying on supplementary indicators.
Limitations of Using the Fourier Transform Indicator Alone
1. Limited Predictive Power in Trending Markets
The Fourier Transform Indicator performs best in cyclical or ranging markets. However, in strongly trending markets, it may fail to provide meaningful insights.
This limitation occurs because trends lack repetitive cycles, which the Fourier Transform relies on to generate signals.
Key takeaway: The indicator is not suitable for markets dominated by strong, unidirectional trends.
2. Best Used with Complementary Indicators
While it excels at identifying cycles, the Fourier Transform lacks the momentum analysis needed to confirm trade setups. Combining it with tools like the Relative Strength Index (RSI) or Moving Averages helps validate its findings.
For example, traders might use RSI to confirm overbought or oversold conditions in addition to Fourier-based cycle detection.
Key takeaway: Pairing Fourier Transform with complementary indicators reduces false signals and improves accuracy.
Pro Tip: Combining Fourier Transform for Better Results
To maximize its potential, combine the Fourier Transform Indicator with trend-following or momentum indicators. This creates a comprehensive strategy for both cyclic and trending markets.
For further insights on building robust trading strategies, refer to this trusted resource on technical indicators.

Step-by-Step Guide to Trade with the Fourier Transform Indicator
Trading with the Fourier Transform Indicator involves leveraging its ability to identify market cycles and patterns. This step-by-step guide ensures you make the most of its capabilities while incorporating complementary tools for enhanced accuracy.
1. Data Preparation: Start with Historical Price Data
Before applying the Fourier Transform, gather reliable historical price data for the asset you intend to analyze.
- Choose the Right Timeframe: The timeframe should align with your trading strategy—intraday, swing, or long-term.
- Ensure Data Quality: Use clean, uninterrupted data to avoid distortions in cycle detection.
Key takeaway: Accurate and relevant historical data is the foundation of effective Fourier Transform analysis.
2. Apply the Fourier Transform: Analyzing Frequency Components
Use trading platforms or custom scripts to apply the Fourier Transform on the prepared price data.
- Step 1: Load the data into Fourier Transform software or a coding tool like Python.
- Step 2: Run the Fourier algorithm to break the data into its frequency components.
- Step 3: Review the output for dominant cycles.
Key takeaway: Fourier Transform translates price movements into manageable cyclic components for better pattern recognition.
3. Interpret Results: Identify Dominant Cycles
Examine the output to locate cycles or patterns influencing the market.
- Dominant Cycles: Look for peaks in the frequency spectrum to identify recurring behaviors.
- Cycle Length: Measure the duration of these cycles to align trading actions accordingly.
For example, a 20-day dominant cycle might suggest recurring trends every month.
Key takeaway: Understanding dominant cycles helps you predict price movements based on past behavior.
4. Make Trading Decisions: Develop a Strategy
Use the insights gained from the Fourier Transform to make informed trading decisions.
- Combine with Other Indicators: Confirm signals using complementary tools like RSI or MACD.
- Strategic Actions: Buy near the cycle troughs and sell near the peaks.
- Risk Management: Always set stop-loss levels to manage potential losses.
Key takeaway: Combining Fourier-based insights with a well-rounded strategy enhances accuracy and reduces risk.
5. Monitor and Adjust: Refining Your Approach
Markets evolve, and so should your analysis. Continuously refine Fourier Transform parameters based on new data.
- Update Regularly: Reapply the Fourier Transform periodically to stay aligned with changing market conditions.
- Experiment with Settings: Adjust timeframes and filters to suit different trading scenarios.
Key takeaway: Ongoing monitoring ensures your strategy remains effective over time.
Pro Tip: Enhance Performance with Complementary Tools
While Fourier Transform is excellent for cycle detection, pairing it with trend-following or momentum indicators boosts reliability. For a deeper dive into trading strategies, explore this comprehensive trading guide.

Example of Using the Fourier Transform Indicator
This case study demonstrates the application of the Fourier Transform Indicator on stock price data to identify market cycles. The process highlights a practical example of trading decisions based on detected cycles.
Case Study: Applying Fourier Transform to Stock Price Data
1. Preparing the Data for Analysis
We use historical price data for a hypothetical stock, spanning six months.
- Chosen Timeframe: Daily price data to analyze medium-term trends.
- Software Used: A trading platform with Fourier Transform capabilities or Python for custom scripts.
Key takeaway: Accurate, high-quality data is critical for meaningful Fourier Transform results.
2. Identifying a Dominant 30-Day Cycle
After applying the Fourier Transform, the output reveals a dominant 30-day cycle in the stock’s price movement.
- Cycle Observation: Peaks in the frequency spectrum show significant periodicity every 30 days.
- Market Insight: Prices tend to rise and fall within this recurring cycle.
Key takeaway: Recognizing dominant cycles helps predict future price movements.
Example Trades Based on Cycle Highs and Lows
1. Planning the Trades
- Buy Signal: Enter a long position when the price nears the cycle trough.
- Sell Signal: Exit the position or short the stock near the cycle peak.
2. Executing the Trades
- Step 1: On day 28, observe the price nearing the trough and initiate a buy order.
- Step 2: Monitor price progression toward the peak, occurring around day 15 of the next cycle.
- Step 3: Exit the trade or short the stock when the price reaches the peak.
Key takeaway: Aligning trades with cycle highs and lows optimizes returns.
Practical Walkthrough: Using Software for Fourier Transform Analysis
Step-by-Step Process:
- Load the stock’s price data into the software or Python script.
- Run the Fourier Transform analysis to identify dominant cycles.
- Visualize the results using frequency graphs to locate significant peaks.
For example, Python users can employ libraries like SciPy for Fourier analysis. Platforms like TradingView may also provide Fourier Transform indicators.
Key takeaway: User-friendly software simplifies Fourier analysis, making it accessible to traders of all levels.
Pro Tip: Combining Fourier Transform with Other Indicators
Pair Fourier analysis with tools like RSI to confirm overbought or oversold conditions near cycle peaks or troughs. For detailed instructions on using Fourier Transform in trading, visit this trusted resource on trading indicators.

When Can You Turn a Profit with the Fourier Transform Indicator?
The Fourier Transform Indicator can yield profitable results under the right conditions. However, proper application, analysis, and risk management are essential for success.
Key Conditions for Profitability
1. Presence of Clear and Repeatable Cycles in the Market
The Fourier Transform Indicator thrives in markets exhibiting consistent and identifiable cycles.
- Cyclic Markets: Assets with seasonal patterns, like commodities or indices, are ideal.
- Signal Precision: Dominant frequencies provide actionable entry and exit points.
For instance, a 50-day recurring cycle in a stock’s price can guide buy and sell decisions effectively.
Key takeaway: Profitability depends on identifying and exploiting repeatable market cycles.
2. Adequate Backtesting and Optimization of Strategies
Backtesting ensures your Fourier-based strategy is robust under various conditions.
- Historical Testing: Analyze past performance to validate cycle accuracy and profitability.
- Optimization: Refine parameters like timeframes and frequency filters to suit specific assets.
Key takeaway: Backtesting minimizes errors and increases confidence in trading decisions.
3. Combining Fourier Transform with Risk Management
Risk management is critical to preserve capital and maximize profits.
- Position Sizing: Limit exposure by allocating a percentage of your portfolio per trade.
- Stop-Loss Orders: Protect against unexpected price moves with pre-set exit levels.
Key takeaway: Effective risk management complements Fourier insights, reducing the likelihood of losses.
Challenges to Consider
1. Proper Interpretation and Complementary Tools Are Necessary
The Fourier Transform Indicator is not a standalone solution.
- Complementary Indicators: Combine it with RSI or MACD to confirm trends or overbought/oversold conditions.
- Avoid Over-Reliance: Misinterpreting cycles or ignoring other market factors can lead to poor decisions.
Key takeaway: Use Fourier Transform alongside other indicators for a well-rounded strategy.
Example Trades Based on Cycle Highs and Lows
1. Planning the Trades
- Buy Signal: Enter a long position when the price nears the cycle trough.
- Sell Signal: Exit the position or short the stock near the cycle peak.
2. Executing the Trades
- Step 1: On day 28, observe the price nearing the trough and initiate a buy order.
- Step 2: Monitor price progression toward the peak, occurring around day 15 of the next cycle.
- Step 3: Exit the trade or short the stock when the price reaches the peak.
Key takeaway: Aligning trades with cycle highs and lows optimizes returns.
2. Misuse in Non-Cyclic or Highly Volatile Markets
The indicator underperforms in markets without clear cycles or during periods of high volatility.
- Non-Cyclic Markets: Strongly trending markets lack the repetitive behavior Fourier relies on.
- Volatility Risks: Random fluctuations can distort cycle detection, leading to inaccurate signals.
Key takeaway: Avoid using Fourier Transform in unsuitable market conditions to prevent unnecessary losses.
Pro Tip: Ensure Continuous Learning and Refinement
Regularly update your understanding of Fourier analysis and adapt your strategy as market conditions evolve. To explore more on Fourier Transform and its applications, visit this detailed guide on technical analysis.

Introduction to Mathematical and Practical Insights
The Fourier Transform Indicator provides traders with a dual perspective: mathematical precision and practical utility. Its ability to analyze periodicity in market data makes it a valuable tool for informed decision-making.
Mathematical Insights: How Fourier Transform Captures Periodicity
1. Fourier Transform Captures Cyclic Patterns in Time Series Data
The Fourier Transform breaks down price movements into individual frequency components.
- Mathematical Basis: By analyzing cycles, it identifies patterns invisible to the naked eye.
- Frequency Domain Analysis: Detects recurring price movements, helping traders focus on dominant market cycles.
For instance, a Fourier analysis of stock data might reveal a recurring 20-day cycle of highs and lows.
Key takeaway: Fourier Transform transforms chaotic market data into understandable cyclic trends.
2. Identifying Market Inefficiencies Using Fourier Analysis
Market inefficiencies arise when price movements deviate from typical behavior. Fourier Transform helps locate such opportunities.
- Anomalous Cycles: Spot inconsistencies in dominant frequencies that may signal a trading opportunity.
- Mathematical Precision: Quantifies deviations for actionable insights.
Key takeaway: Identifying inefficiencies can lead to profitable trades by exploiting non-random market behavior.
Practical Insights: Leveraging Fourier Transform in Trading
1. Using Fourier Transform for Noise Filtering
Markets are often noisy, with random fluctuations obscuring trends. Fourier Transform filters this noise effectively.
- Noise Reduction: Eliminates irrelevant data, highlighting meaningful cycles.
- Cleaner Signals: Helps traders focus on actionable patterns without distraction.
For example, filtering noise in a volatile stock can reveal consistent patterns otherwise masked by random spikes.
Key takeaway: Noise reduction enhances clarity, enabling more confident trading decisions.
2. Spotting Mean-Reverting Behaviors for Profitability
Mean-reverting assets return to their average price after deviations. Fourier Transform aids in identifying such behaviors.
- Cycle Peaks and Troughs: Locate extremes in price movement for strategic entries and exits.
- Practical Benefits: Allows traders to capitalize on overbought or oversold conditions.
Key takeaway: Spotting mean-reverting behaviors helps traders align with natural price corrections.
Pro Tip: Combining Mathematical Rigor with Practical Strategies
While Fourier Transform excels at identifying cycles, combining it with momentum or trend indicators improves trading accuracy. For further insights, explore this detailed guide on technical indicators.

Pros and Cons of the Fourier Transform Indicator
The Fourier Transform Indicator is a versatile tool for analyzing market cycles, but it comes with its own set of strengths and weaknesses. Understanding its pros and cons helps traders decide how and when to use it effectively.
Pros of Using the Fourier Transform Indicator
1. Reveals Hidden Market Cycles
The Fourier Transform uncovers recurring cycles that might not be visible through traditional analysis.
- Cycle Analysis: Identifies dominant frequencies within historical price data.
- Practical Benefit: Provides insights into periodic market behaviors for timing entry and exit points.
Key takeaway: Traders can better predict future price movements by understanding hidden cycles.
2. Reduces Noise for Cleaner Data Analysis
Market data is often cluttered with random fluctuations, obscuring meaningful trends. Fourier Transform simplifies the dataset.
- Noise Filtering: Removes irrelevant market noise while retaining critical patterns.
- Improved Clarity: Traders can focus on actionable signals without being distracted by random spikes.
Key takeaway: Noise reduction helps traders identify significant trends and avoid false signals.
3. Enhances Understanding of Market Structure
Fourier Transform provides a unique perspective on how markets behave over time.
- Structural Insights: Helps traders understand periodic trends and irregularities in price data.
- Strategic Advantage: Enables the design of more refined trading strategies based on market structure.
Key takeaway: Insights from Fourier analysis support well-informed trading decisions.
Cons of Using the Fourier Transform Indicator
1. Requires Technical Expertise
Understanding and applying the Fourier Transform requires a solid grasp of both mathematics and technical analysis.
- Steep Learning Curve: Traders need to familiarize themselves with frequency domain concepts.
- Complex Interpretation: Misinterpreting results can lead to poor trading decisions.
Key takeaway: Beginners may struggle with its technical complexity without prior knowledge or training.
2. Ineffective in Strong Trending Markets
Fourier Transform works best in markets with cyclical patterns, making it less useful during trends.
- Trend Limitation: Struggles to provide actionable insights in trending environments.
- Supplementary Tools Required: Needs complementary indicators like Moving Averages to confirm signals.
Key takeaway: It’s unsuitable as a standalone tool in non-cyclic or strongly trending markets.
3. Computationally Intensive Without Modern Tools
Performing Fourier analysis manually or without advanced tools can be time-consuming.
- Processing Power: Requires efficient software or algorithms to handle large datasets.
- Accessibility Issue: Not all trading platforms offer built-in Fourier Transform capabilities.
Key takeaway: Computational requirements can be a barrier for traders without access to modern tools.
Conclusion: Balancing the Pros and Cons
While the Fourier Transform Indicator offers powerful insights into market cycles, it requires technical expertise and is best used in conjunction with other tools. To explore more about technical analysis and Fourier applications, visit this trusted trading guide.

Complementary Indicators or Tools for Fourier Transform Analysis
The Fourier Transform Indicator excels at identifying market cycles, but pairing it with complementary tools enhances accuracy and decision-making. These tools help confirm signals, contextualize trends, and validate trading opportunities.
1. Momentum Indicators: Confirming Cycle Peaks and Troughs
Using RSI to Identify Overbought and Oversold Conditions
The Relative Strength Index (RSI) complements Fourier analysis by confirming cycle highs and lows.
- Cycle Confirmation: RSI detects overbought levels near cycle peaks and oversold levels near cycle troughs.
- Practical Use: Align Fourier cycles with RSI thresholds (e.g., above 70 or below 30) for entry and exit points.
For example, a Fourier-indicated trough aligned with RSI oversold conditions strengthens the buy signal.
Key takeaway: RSI refines Fourier signals by adding a momentum-based perspective.
Applying MACD for Trend and Momentum Alignment
The Moving Average Convergence Divergence (MACD) helps validate Fourier Transform’s cycle predictions.
- Signal Confirmation: Detect crossovers near Fourier-indicated peaks or troughs.
- Enhanced Accuracy: Ensures trades align with prevailing momentum for better timing.
Key takeaway: MACD reduces the risk of acting on false Fourier signals.
2. Trend Indicators: Contextualizing Cycles in Broader Trends
Using Moving Averages for Trend Direction
Moving Averages, such as SMA or EMA, provide trend context to Fourier-derived cycles.
- Cycle-Trend Alignment: Ensure Fourier-indicated signals align with the overall market trend.
- Avoid Counter-Trend Trades: Enter trades only when the cycle direction matches the moving average trend.
For example, buy signals during upward trends are more reliable than counter-trend signals.
Key takeaway: Moving Averages help traders filter Fourier signals within broader trend dynamics.
Bollinger Bands for Volatility Context
Bollinger Bands add a volatility perspective, which complements Fourier Transform’s cycle analysis.
- Volatility Insight: Identify potential cycle reversals near the upper or lower Bollinger Bands.
- Practical Use: Combine Fourier peaks and Bollinger Band extremes for precise entry points.
Key takeaway: Bollinger Bands provide additional confirmation by incorporating volatility into Fourier signals.
3. Volume Analysis: Validating Fourier Transform Signals
Volume Confirmation for Reliable Signals
Volume analysis ensures Fourier signals are backed by strong market participation.
- Increased Confidence: High volume near Fourier-indicated cycle peaks or troughs strengthens signal reliability.
- Avoid Low-Volume Traps: Skip signals lacking volume support to reduce false trades.
For example, a Fourier-indicated reversal during a volume spike increases the likelihood of success.
Key takeaway: Volume analysis validates Fourier Transform signals with market participation data.
Conclusion: Synergizing Fourier Transform with Complementary Tools
Combining the Fourier Transform Indicator with tools like RSI, MACD, Moving Averages, Bollinger Bands, and volume analysis ensures a comprehensive trading strategy. To explore these indicators further, visit this trusted guide on trading indicators.

Market Types and Timeframes for Fourier Transform Analysis
The Fourier Transform Indicator is highly effective in specific market conditions and timeframes. Understanding where it works best ensures its application delivers optimal results.
Best Market Types for the Fourier Transform Indicator
1. Ranging or Cyclic Markets
The Fourier Transform excels in identifying periodic cycles, making it ideal for ranging markets.
- Cyclic Patterns: Works best when price data shows consistent highs and lows over time.
- Predictable Behavior: Detects repeating cycles to time entries at troughs and exits at peaks.
For example, stocks with seasonal patterns or currencies in stable trading ranges are ideal candidates.
Key takeaway: Use Fourier Transform in markets that exhibit recurring cycles and clear mean-reversion behavior.
2. Medium-Term Timeframes with Observable Periodicity
Medium-term timeframes (daily or 4-hour charts) provide the best balance for Fourier analysis.
- Cycle Identification: These timeframes offer sufficient data for accurate frequency detection.
- Actionable Signals: Cycles identified on medium-term charts align well with typical swing trading strategies.
Key takeaway: Medium-term timeframes enhance the Fourier Transform’s effectiveness by revealing actionable cycles.
Less Effective Market Types for the Fourier Transform Indicator
1. High-Volatility, Trending Markets
The Fourier Transform struggles in markets dominated by sharp trends or unpredictable price movements.
- Signal Mismatch: Trending markets often lack the periodicity Fourier analysis relies on.
- False Signals: Cycles detected during volatile trends can result in poor trade timing.
For example, avoid using Fourier Transform during breakout phases or parabolic price movements.
Key takeaway: It’s unsuitable for markets where strong trends overshadow cyclic behavior.
2. Extremely Short or Long Timeframes Without Clear Cycles
Timeframes that are too short or too long diminish the Fourier Transform’s effectiveness.
- Short Timeframes: Intraday charts may have insufficient data to detect reliable cycles.
- Long Timeframes: Annual charts may obscure meaningful periodicity due to excessive smoothing.
Key takeaway: Choose timeframes where periodicity is clearly visible to maximize Fourier Transform’s utility.
Conclusion: Matching Fourier Transform with Market Conditions
The Fourier Transform Indicator is best suited for cyclic markets and medium-term timeframes, offering actionable insights when periodicity is clear. However, avoid using it in trending or highly volatile environments to reduce false signals. To deepen your understanding of market conditions and timeframes, explore this trusted resource on market types.

Limitations and Avoiding Misuse of the Fourier Transform Indicator
The Fourier Transform Indicator offers valuable insights, but understanding its limitations and avoiding common mistakes is crucial for successful trading.
Common Missteps When Using the Fourier Transform Indicator
1. Overfitting the Indicator to Historical Data
Overfitting occurs when traders fine-tune the Fourier Transform excessively to match past data.
- False Confidence: A perfectly fit model on historical data often fails in live markets.
- Reduced Generalization: Overfitting limits the indicator’s adaptability to new market conditions.
For example, a cycle that aligns perfectly in backtesting may not hold in real-time scenarios.
Key takeaway: Avoid over-reliance on historical patterns when applying Fourier analysis.
2. Misinterpreting Results as Predictive Rather Than Descriptive
The Fourier Transform is descriptive and not inherently predictive.
- Cycle Identification: It highlights existing patterns but doesn’t guarantee their continuation.
- Misleading Assumptions: Believing cycles will persist without confirmation can lead to false trades.
For instance, markets often break their cycles during unexpected events or news releases.
Key takeaway: Treat Fourier results as a reflection of past market behavior, not future guarantees.
How to Avoid Misuse of the Fourier Transform Indicator
1. Use Fourier Transform as a Supplementary Tool
Combining Fourier analysis with complementary indicators reduces the risk of over-reliance.
- Validation: Use momentum tools like RSI or MACD to confirm cycle signals.
- Enhanced Context: Pair with trend indicators to ensure trades align with broader market conditions.
Key takeaway: Rely on Fourier Transform as part of a broader trading strategy.
Conclusion: Using Fourier Transform Responsibly
Understanding its limitations helps traders harness the Fourier Transform Indicator effectively. Avoid overfitting and misinterpretation by combining it with other tools and recalibrating regularly. To learn more about indicator optimization, visit this trusted resource on trading strategies.

Advanced Trading Strategies with the Fourier Transform Indicator
Experienced traders can unlock the full potential of the Fourier Transform Indicator by applying it to sophisticated strategies across various markets.
1. Pair Trading with Fourier Transform Cycles
Pair trading involves leveraging Fourier analysis to identify cycles across correlated assets.
- Identifying Correlations: Use Fourier Transform to uncover synchronized cycles in related instruments, such as stock pairs or currency pairs.
- Arbitrage Opportunities: Enter long and short positions based on cycle divergences between correlated assets.
For example, if two stocks show matching 30-day cycles but one diverges temporarily, traders can exploit the reversion.
Key takeaway: Fourier Transform enhances pair trading by revealing cyclic imbalances for strategic entries and exits.
2. Seasonal Pattern Analysis in Futures and Commodities
Futures and commodities often exhibit strong seasonal trends, making them ideal for Fourier analysis.
- Uncovering Seasonality: Fourier Transform detects recurring patterns in assets like gold, oil, or agricultural commodities.
- Timing Entries: Traders can optimize buy or sell decisions based on identified seasonal cycles.
For instance, if Fourier analysis highlights a consistent dip in oil prices during certain months, traders can plan entries.
Key takeaway: Applying Fourier Transform to seasonality reveals profitable opportunities in cyclical commodities markets.
3. Multi-Asset Fourier Analysis for Deeper Insights
Advanced traders can analyze multiple assets simultaneously to uncover market-wide trends and cycles.
- Cross-Market Analysis: Identify shared cycles across indices, commodities, and currencies to spot macroeconomic influences.
- Risk Diversification: Use Fourier results to create a diversified portfolio based on complementary cycles.
For example, aligning stock indices’ cycles with currency movements provides a holistic market view.
Key takeaway: Multi-asset Fourier analysis broadens perspectives, uncovering inter-market relationships and trends.
Conclusion: Maximizing Potential with Fourier Transform Strategies
By incorporating Fourier analysis into advanced trading techniques, experienced traders can tap into cyclic patterns and inter-market dynamics. From pair trading to seasonal analysis, these strategies offer significant profit potential when combined with robust risk management. For further insights, check out this trusted guide on advanced trading strategies.

Backtesting and Optimization for the Fourier Transform Indicator
Backtesting and optimization are essential steps to ensure Fourier Transform strategies are both accurate and effective in live trading.
Importance of Backtesting Fourier Transform Strategies
1. Validate Strategies with Historical Data
Testing Fourier-based strategies on historical price data verifies their effectiveness.
- Performance Insights: Analyze how well the Fourier Transform identifies cycles and aligns with profitable trades.
- Risk Assessment: Determine if the strategy minimizes losses during unfavorable conditions.
For example, backtesting a 30-day Fourier cycle strategy can reveal its reliability in various market phases.
Key takeaway: Backtesting ensures that your Fourier Transform strategy is grounded in historical evidence.
2. Refine Parameters for Enhanced Accuracy
Parameter tuning minimizes noise and sharpens cycle detection.
- Optimal Settings: Adjust Fourier parameters like frequency range to match market conditions and timeframes.
- Improved Signal Clarity: Fine-tuned settings reduce false positives and enhance trading decisions.
For instance, refining frequency thresholds can help traders detect meaningful cycles while ignoring irrelevant fluctuations.
Key takeaway: Parameter refinement improves the precision of Fourier-based trading strategies.
Optimization Techniques for Fourier Transform Strategies
1. Leverage Automated Tools for Dynamic Adjustments
Automation simplifies the optimization process and adapts settings to changing markets.
- Algorithmic Solutions: Use software to test multiple parameter combinations efficiently.
- Real-Time Adjustments: Dynamic optimization updates Fourier settings as market cycles evolve.
For example, trading platforms like MetaTrader or Python-based scripts automate Fourier analysis effectively.
Key takeaway: Automation enhances efficiency and adaptability in Fourier strategy optimization.
2. Test Robustness with Out-of-Sample Data
Out-of-sample testing ensures the strategy performs well in unseen market conditions.
- Avoid Overfitting: Testing on new data prevents strategies from being overly tailored to historical patterns.
- Ensure Consistency: Robust Fourier strategies maintain performance across varied datasets.
For instance, backtesting on 2010-2020 data and validating on 2021-2023 data highlights the strategy’s resilience.
Key takeaway: Out-of-sample testing builds confidence in Fourier strategies’ reliability.
Conclusion: Building Confidence in Fourier Transform Strategies
Backtesting and optimization are crucial for fine-tuning Fourier Transform strategies, reducing risk, and enhancing profitability. By leveraging automation and robust testing techniques, traders can build a reliable foundation for real-world success. For more insights on backtesting tools, visit this trusted guide to strategy testing.

FAQs and Common Misconceptions about the Fourier Transform Indicator
The Fourier Transform Indicator is a powerful tool, but traders often have questions or misunderstand its application. Below are key FAQs addressed clearly.
1. Is Fourier Transform Suitable for All Markets?
Best for Cyclic or Mean-Reverting Markets
Fourier Transform excels in markets with clear periodic behaviors.
- Cyclic Markets: Ideal for markets where price movements repeat over predictable timeframes.
- Mean-Reverting Assets: Works well for assets that return to average values after deviations.
For instance, Fourier analysis can effectively detect recurring patterns in currency pairs or seasonal commodities.
Key takeaway: Fourier Transform is not ideal for trending or volatile markets lacking defined cycles.
2. Does the Fourier Transform Predict Price Movements?
Focuses on Market Rhythms, Not Price Prediction
The Fourier Transform doesn’t forecast future prices but reveals hidden cycles.
- Descriptive Analysis: Highlights the dominant frequencies within historical price data.
- Strategy Development: Helps traders align their actions with observed cycles.
For example, Fourier results can indicate when to expect market reversals based on cyclic patterns.
Key takeaway: Use Fourier Transform to understand market rhythms rather than predict exact price changes.
3. How Complex Is Fourier Transform for Beginners?
Accessible Applications Despite Mathematical Complexity
While Fourier Transform involves advanced math, modern software simplifies its application.
- Software Support: Tools like Python libraries, trading platforms, or Excel add-ons make it beginner-friendly.
- Focus on Outputs: Traders can rely on cycle insights without delving into mathematical equations.
For instance, many platforms visualize Fourier results as graphs or heatmaps for easy interpretation.
Key takeaway: Beginners can focus on practical outputs rather than the math behind the Fourier Transform.
Conclusion: Demystifying the Fourier Transform Indicator
Understanding these FAQs helps traders make informed decisions about applying Fourier Transform. By focusing on its strengths in cyclic markets and leveraging software, even beginners can benefit. Explore this guide on beginner-friendly Fourier tools for more insights.

Conclusion: Maximizing the Potential of the Fourier Transform Indicator
The Fourier Transform Indicator offers traders a unique way to analyze markets by uncovering hidden cycles and filtering out noise. It is a valuable tool for those willing to invest time in understanding its applications and limitations. Here’s a summary of its key takeaways.
A Powerful Tool for Identifying Cycles
The Fourier Transform excels in identifying periodic patterns and understanding market rhythms.
- Cyclic Markets: Best suited for markets with repeating behaviors, like seasonal commodities or currency pairs.
- Noise Reduction: Helps traders focus on meaningful data, cutting through market fluctuations.
By using the Fourier Transform, traders can gain a clearer perspective on price movements and time their trades more effectively.
Importance of Pairing with Complementary Indicators
While the Fourier Transform is powerful, it works best when combined with other tools.
- Trend Indicators: Use Moving Averages or Bollinger Bands to identify directional trends.
- Momentum Tools: RSI or MACD can confirm entry and exit points based on cycles.
Pairing Fourier Transform with these indicators enhances trading accuracy, especially in volatile or trending markets.
Avoid Misuse Through Proper Backtesting
Backtesting and optimizing Fourier-based strategies on historical data are essential for avoiding common pitfalls.
- Parameter Tuning: Regular adjustments ensure the indicator remains effective in dynamic markets.
- Realistic Expectations: Remember that Fourier Transform is descriptive, not predictive.
Testing strategies across multiple scenarios can prevent overfitting and improve long-term performance.
Embrace Learning and Experimentation
For beginners and advanced traders alike, exploring Fourier Transform can open doors to new opportunities.
- Learn Gradually: Start with software that simplifies Fourier analysis and focus on interpreting outputs.
- Experiment Creatively: Use Fourier analysis for seasonal patterns, multi-asset strategies, or pair trading.
With consistent effort and strategic use, the Fourier Transform Indicator can become an indispensable part of your trading toolkit.
Final Thoughts
Mastering the Fourier Transform Indicator requires patience and practice, but the insights gained can significantly enhance your trading results. Combine it with robust risk management and complementary tools to unlock its full potential. For more detailed guidance, explore this trusted resource on market analysis tools.
Harness the Coppock Curve for success! Spot long-term trends, minimize risks, and elevate your trading strategies with confidence.
Terms and Conditions
Educational Purpose
The content provided in this article is intended for informational and educational purposes only. It does not constitute financial, investment, or trading advice.