
Use multi-timeframe SMA analysis to identify trends and refine trade entries for improved accuracy.

Understanding the Chaikin Money Flow (CMF) Indicator: A Guide to Market Analysis
What Is the Simple Moving Average (SMA)?
The Simple Moving Average (SMA) is one of the most popular technical analysis tools. It helps traders by calculating the average price of an asset over a specified period. By smoothing price data, it assists in identifying trends and making more informed trading decisions.
How the Simple Moving Average (SMA) Is Calculated
To calculate the SMA, sum the closing prices of an asset over a set number of periods, then divide the total by that number. For example, a 10-day SMA sums the closing prices of the last 10 days and divides the result by 10.
The Role of the SMA in Technical Analysis
Smoothing Out Price Fluctuations
The SMA helps smooth price fluctuations, making it easier to identify trends by reducing market noise. This allows traders to focus on the long-term direction rather than short-term price movements.
Identifying Market Trends
Traders can use the SMA to spot the direction of the market. By analyzing the slope of the SMA, traders can determine whether the market is in an uptrend, downtrend, or sideways movement. Here are key interpretations:
Upward-sloping SMA: Indicates a bullish (upward) trend.
Downward-sloping SMA: Signals a bearish (downward) trend.
Signal Generation with the SMA
The SMA can also generate buy or sell signals based on price action. When the price crosses above the SMA, it may signal a buying opportunity. Conversely, when the price drops below the SMA, it could suggest a selling point. Additionally, crossovers between short-term and long-term SMAs often signal potential trend reversals.
By using the SMA effectively, traders can enhance their market analysis and make better trading decisions. Learn more about SMA applications in trading here.
![OnePlus [CPS] Many Geos](data:image/svg+xml;base64,PHN2ZyB4bWxucz0iaHR0cDovL3d3dy53My5vcmcvMjAwMC9zdmciIHdpZHRoPSI3MjgiIGhlaWdodD0iOTAiIHZpZXdCb3g9IjAgMCA3MjggOTAiPjxyZWN0IHdpZHRoPSIxMDAlIiBoZWlnaHQ9IjEwMCUiIHN0eWxlPSJmaWxsOiNjZmQ0ZGI7ZmlsbC1vcGFjaXR5OiAwLjE7Ii8+PC9zdmc+)

Simple Moving Average (SMA) Indicator Formula
The Simple Moving Average (SMA) is one of the most widely used indicators in technical analysis. It helps traders smooth out price data to identify trends. Here’s how it’s calculated:
Mathematical Formula for SMA
The SMA is computed by averaging the asset’s closing prices over a specific period. The formula is:

This formula calculates the average price over a set number of periods, providing a clear picture of the asset’s trend.
For a detailed guide on SMA formulas, check out Investopedia’s SMA Overview.
Key Components of the SMA
1. Closing Price (PiP_iPi)
The closing price is the last price at which an asset is traded within a given period. This is used because it represents the final market consensus for that period.
2. Number of Periods (nnn)
The number of periods defines how long the average is calculated. Common settings include:
Short-term SMA (e.g., 10 periods) – reacts quickly to price changes.
Long-term SMA (e.g., 50 or 200 periods) – offers a smoother and more stable trend.
The longer the period, the more it smooths out fluctuations, but it also responds slower to new price information.
Example Calculation of SMA
To calculate a 5-day SMA, let’s assume the closing prices of a stock are:
Day 1: $10
Day 2: $12
Day 3: $11
Day 4: $13
Day 5: $12
Step-by-Step Calculation:
Sum the closing prices:
10+12+11+13+12=5810 + 12 + 11 + 13 + 12 = 5810+12+11+13+12=58Divide by the number of periods:
585=11.6\frac{58}{5} = 11.6558=11.6
Thus, the 5-day SMA is $11.6.
This SMA smooths out price fluctuations, allowing traders to better understand the trend over the period.
For further insights on SMA calculations, explore Babypips’ SMA Guide.
Interpreting SMA for Trading Decisions
By analyzing the direction of the SMA, traders can determine the market trend:
Upward-sloping SMA: Indicates a bullish trend.
Downward-sloping SMA: Signals a bearish trend.
Signal Generation with the SMA
The SMA can generate buy or sell signals when the price crosses above or below the moving average. Additionally, crossovers between short-term and long-term SMAs are often used to identify potential trend reversals.
Using the SMA effectively can significantly enhance a trader’s decision-making process. For more detailed strategies, check out this guide on SMA trading applications.

When and How to Use the Simple Moving Average (SMA) Indicator
Best Market Conditions for SMA Use
Trending Markets
The Simple Moving Average (SMA) works best in trending markets, where prices move in a clear direction. An upward-sloping SMA indicates a bullish trend, while a downward-sloping SMA signals a bearish trend. In these conditions, SMA helps traders stay aligned with the prevailing market direction.
For example, a 50-day SMA can confirm a stock’s long-term uptrend, providing confidence in holding long positions. Learn more about identifying trends with SMA at Babypips.
Avoiding Whipsaws in Sideways Markets
In range-bound or sideways markets, the SMA may give false signals, known as whipsaws. During these periods, prices frequently cross the SMA without establishing a trend. To avoid losses, combine the SMA with indicators like RSI or MACD for confirmation.
Choosing Timeframes and SMA Settings
Short-Term SMA (10-20 Periods)
Short-term SMAs react quickly to price changes, making them ideal for day traders. These SMAs capture minor price movements, providing signals for quick entries and exits. However, they may generate more false signals in volatile markets.
Medium-Term SMA (50 Periods)
A 50-period SMA balances responsiveness and stability, making it suitable for swing trading. It helps traders identify intermediate trends while filtering minor fluctuations.
Long-Term SMA (200 Periods)
The 200-period SMA is a popular choice for identifying major market trends. Investors often use it as a benchmark to determine overall market direction. When the price stays above the 200-SMA, it indicates bullish sentiment, while prices below suggest bearish sentiment.
Explore detailed SMA strategies across timeframes at Investopedia.
Entry and Exit Signals with SMA
Crossovers
Price Crossing the SMA: A buy signal occurs when the price crosses above the SMA. Conversely, a sell signal occurs when the price crosses below.
SMA Crossovers: A bullish crossover happens when a shorter SMA (e.g., 20-SMA) moves above a longer SMA (e.g., 50-SMA). A bearish crossover occurs when the opposite happens.
Dynamic Support and Resistance
The SMA often acts as a dynamic support or resistance level. In an uptrend, prices tend to bounce off the SMA as support. In a downtrend, the SMA serves as a resistance barrier.
By recognizing these signals, traders can optimize their entry and exit points. For more insights, visit Babypips.

Can the Simple Moving Average (SMA) Indicator Be Used Alone?
Standalone Use of the Simple Moving Average (SMA)
The Simple Moving Average (SMA) is a widely used technical indicator due to its simplicity. It helps traders identify trends, smooth price fluctuations, and generate entry or exit signals. However, relying solely on SMA has limitations.
Since SMA is a lagging indicator, it reacts to past price movements rather than predicting future trends. In volatile or sideways markets, SMA may generate false signals, leading to whipsaws. For instance, in a choppy market, prices frequently cross the SMA, causing confusion for traders.
While SMA can be effective in trending markets, it lacks the ability to measure momentum or confirm trend strength. To enhance accuracy, traders often combine SMA with other technical indicators. Learn more about the limitations of SMA at Investopedia.
Enhancing SMA with Other Technical Indicators
Using SMA in combination with other indicators improves its effectiveness. Common complementary indicators include:
Relative Strength Index (RSI): Confirms overbought or oversold conditions alongside SMA signals.
Moving Average Convergence Divergence (MACD): Helps measure trend momentum and confirm SMA crossovers.
Bollinger Bands: Identifies volatility and price deviations from the SMA.
Volume Indicators: Confirms breakout strength when prices cross the SMA.
For example, an SMA crossover strategy combined with RSI can filter out false signals. If the price crosses above the SMA and RSI confirms bullish momentum, the trade has a higher probability of success. Find more SMA-based strategies at Babypips.
The Risk of Overreliance on SMA Alone
Depending solely on SMA for trading decisions can lead to poor outcomes. Since SMA smooths past price data, it does not react instantly to sudden market changes. This lagging nature can cause traders to enter trades too late or miss key reversals.
Additionally, SMA lacks the ability to analyze volume, volatility, or price patterns. Traders who rely only on SMA may struggle in fast-moving markets where price action shifts rapidly. To mitigate risks, combining SMA with other indicators and price action analysis is recommended.
A diversified approach increases trading accuracy and minimizes unnecessary losses. Learn how to optimize your trading strategy with multiple indicators at Investopedia.

Step-by-Step Guide to Trade with the Simple Moving Average (SMA) Indicator
Step 1: Set Up SMA on the Chart
Before using the Simple Moving Average (SMA) for trading, you need to add it to your chart. Most trading platforms, including MetaTrader, TradingView, and ThinkorSwim, allow easy integration of SMAs.
How to Add SMA:
Open your trading platform and select your preferred asset (stocks, forex, or crypto).
Locate the “Indicators” section and search for “Simple Moving Average.”
Choose the SMA period (e.g., 10, 50, or 200) based on your trading style.
Adjust the SMA color and line thickness for better visibility.
Short-term traders prefer 10-20 SMAs for quick signals, while long-term traders use 50-200 SMAs to identify major trends. Learn how to configure SMA settings at TradingView’s Guide.
Step 2: Identify Trend Direction
Once the SMA is on your chart, use it to determine the market trend.
Methods to Identify Trends:
SMA Slope: An upward-sloping SMA signals a bullish trend, while a downward-sloping SMA suggests a bearish trend.
Price Position Relative to SMA:
If the price is above the SMA, the market is in an uptrend.
If the price is below the SMA, the market is in a downtrend.
For example, when a stock trades consistently above the 50-SMA, it confirms a strong uptrend. Discover more about trend analysis at Investopedia.
Step 3: Spot Trading Signals
SMA generates buy and sell signals based on price interactions. The two most common strategies are:
1. SMA Crossover Strategy:
A buy signal occurs when a short-term SMA (e.g., 10-SMA) crosses above a long-term SMA (e.g., 50-SMA).
A sell signal happens when the short-term SMA crosses below the long-term SMA.
2. Bounce from SMA Strategy:
In an uptrend, the price often retraces to the SMA before continuing higher.
In a downtrend, the SMA acts as resistance where price bounces downward.
Combining SMA signals with RSI or MACD improves trade accuracy. Learn more at Babypips.
Step 4: Manage Risk Effectively
Risk management is crucial for protecting capital. Using stop-loss and take-profit levels helps reduce potential losses.
Stop-Loss Placement:
Place the stop-loss below the SMA in an uptrend.
Set the stop-loss above the SMA in a downtrend.
Take-Profit Strategy:
Use the next resistance level as a take-profit target in an uptrend.
Set the take-profit at the next support level in a downtrend.
For example, in a buy trade above the 50-SMA, a stop-loss can be placed just below the SMA to minimize risk. Learn more about risk management at Investopedia.
Step 5: Monitor and Adjust Trades
Market conditions change, so regularly monitoring your trades is essential.
How to Adjust Your Strategy:
If the trend reverses, consider closing the trade early.
Adjust stop-loss levels as the price moves in your favor to lock in profits.
Use additional indicators, like Bollinger Bands, to assess market volatility.
Traders should remain flexible and adapt to price behavior rather than relying solely on SMA signals. Find real-time market monitoring tips at TradingView.

Example for Simple Moving Average (SMA) Indicator
Case Study: Using SMA on a Stock Chart
Let’s analyze a real-world example of the Simple Moving Average (SMA) applied to stock trading. Suppose we are trading Apple Inc. (AAPL) and using a 50-SMA and 200-SMA crossover strategy.
The 50-SMA (short-term trend) reacts quickly to price changes.
The 200-SMA (long-term trend) helps identify the overall market direction.
When the 50-SMA crosses above the 200-SMA, it signals a bullish trend. This is known as a golden cross and is considered a strong buy signal.
For a deeper understanding of SMA strategies, visit Investopedia.
Bullish Crossover and Trade Execution
Imagine AAPL is trading at $150 per share, and the 50-SMA moves above the 200-SMA. A trader executes the following trade:
Entry: Buy at $152 when the crossover confirms an uptrend.
Stop-Loss: Set below the 200-SMA at $145 to limit risk.
Take-Profit Target: Aim for resistance at $170.
As long as the price stays above the 200-SMA, the uptrend remains valid. If the price closes below the SMA, an exit strategy is considered.
For more trade execution insights, visit Babypips.
Visualizing Profit/Loss Potential
If the price moves as expected:
Scenario 1 (Profitable Trade): AAPL rises to $170, yielding an $18 per share profit.
Scenario 2 (Loss Scenario): AAPL drops to $145, triggering the stop-loss for a $7 per share loss.
This strategy ensures risk is managed while taking advantage of potential gains. Traders can adjust their SMA settings based on market conditions.

When Can You Turn a Profit with the Simple Moving Average (SMA) Indicator?
Market Suitability: When Does SMA Work Best?
The Simple Moving Average (SMA) performs best in trending markets, where price movements follow a clear direction.
In an uptrend, the price remains above the SMA, offering buying opportunities on pullbacks.
In a downtrend, the price stays below the SMA, signaling selling opportunities.
However, SMA lags in choppy markets, where price fluctuations cause frequent false signals. In such conditions, traders may experience whipsaws, leading to losses.
For improved accuracy, traders combine SMA with indicators like RSI or MACD to filter out weak signals. Learn more about market conditions and SMA efficiency at Investopedia.
Strategy Optimization: Enhancing SMA Profitability
Traders can optimize SMA settings by adjusting timeframes and performing historical backtesting.
Short-term SMAs (10-20 periods) are ideal for quick trades but can generate false signals.
Medium-term SMAs (50 periods) balance sensitivity and reliability.
Long-term SMAs (200 periods) provide strong trend confirmation but respond slowly to price changes.
Backtesting SMA strategies on past price data helps traders identify profitable settings. By testing different timeframes, traders can find the most suitable SMA strategy for their asset class.
To explore SMA backtesting tools, visit TradingView.
Managing Expectations: The Reality of SMA Profitability
While SMA is a valuable tool, profitability depends on discipline, risk management, and market conditions.
No indicator guarantees 100% success—losses are inevitable, but controlled risk can ensure long-term gains.
Patience is key—SMA strategies work over time, but traders must avoid impulsive decisions.
Combining SMA with volume and momentum indicators increases accuracy.
Successful trading requires a solid strategy, emotional control, and proper trade execution. Learn more about risk-adjusted profitability at Babypips.

Advantages and Limitations of the Simple Moving Average (SMA)
Advantages of the Simple Moving Average (SMA)
1. Easy to Use and Understand
The SMA is one of the simplest technical indicators, making it accessible to beginners and experienced traders alike. Since it calculates the average price over a specific period, it provides a straightforward method to analyze trends without complex formulas.
Unlike advanced indicators, SMA requires no in-depth statistical knowledge, making it ideal for traders looking for a simple yet effective tool. Learn more about moving averages at Investopedia.
2. Smoothing Effect Reduces Market Noise
One of SMA’s key benefits is its ability to filter out short-term price fluctuations, making trends clearer. Unlike raw price action, which can be highly volatile, SMA smooths price movements, helping traders focus on overall direction rather than minor price swings.
For example, a 50-SMA smooths price data over 50 periods, reducing sudden spikes and false signals. However, this smoothing effect also creates a lag, which can delay trade entries.
3. Provides Clear Signals in Trending Markets
SMA is highly effective in identifying trends and signaling potential entry and exit points.
In an uptrend, the price stays above the SMA, confirming bullish momentum.
In a downtrend, the price remains below the SMA, signaling a bearish market.
SMA crossovers, such as the golden cross (50-SMA crossing above 200-SMA), are widely used to confirm trend reversals. Discover more crossover strategies at Babypips.
Strategy Optimization: Enhancing SMA Profitability
Traders can optimize SMA settings by adjusting timeframes and performing historical backtesting.
Short-term SMAs (10-20 periods) are ideal for quick trades but can generate false signals.
Medium-term SMAs (50 periods) balance sensitivity and reliability.
Long-term SMAs (200 periods) provide strong trend confirmation but respond slowly to price changes.
Backtesting SMA strategies on past price data helps traders identify profitable settings. By testing different timeframes, traders can find the most suitable SMA strategy for their asset class.
To explore SMA backtesting tools, visit TradingView.
Managing Expectations: The Reality of SMA Profitability
While SMA is a valuable tool, profitability depends on discipline, risk management, and market conditions.
No indicator guarantees 100% success—losses are inevitable, but controlled risk can ensure long-term gains.
Patience is key—SMA strategies work over time, but traders must avoid impulsive decisions.
Combining SMA with volume and momentum indicators increases accuracy.
Successful trading requires a solid strategy, emotional control, and proper trade execution. Learn more about risk-adjusted profitability at Babypips.

Limitations of the Simple Moving Average (SMA)
Since SMA is based on historical price data, it reacts late to price movements, causing a delay in trade signals. By the time SMA confirms a trend, a significant portion of the move may have already occurred.
For instance, if a stock rapidly breaks out, the SMA may take several periods to adjust, leading to missed opportunities or late entries. This lag makes SMA less effective for traders who rely on fast-moving strategies.
2. Ineffective in Ranging Markets
In sideways or choppy markets, SMA generates frequent false signals as prices constantly fluctuate around the moving average.
In a ranging market, price moves within a fixed zone, making SMA crossovers unreliable.
Traders often experience whipsaws, where SMA signals a trend change that fails to materialize.
To improve accuracy, combining SMA with RSI or Bollinger Bands can help filter false signals. Read more about trading in ranging markets at Investopedia.
Final Thoughts
While SMA is a powerful trend-following tool, traders must recognize its strengths and weaknesses. It is most effective in trending markets but should be used alongside other indicators to minimize false signals in ranging conditions.
Would you like recommendations on which indicators best complement SMA in different market conditions?

SMA in Combination with Other Indicators
Why Combine SMA with Other Indicators?
The Simple Moving Average (SMA) is a powerful trend-following tool, but using it alone can lead to false signals, especially in sideways markets. Combining SMA with other indicators helps filter out noise, confirm signals, and improve trade accuracy.
For a deeper understanding of indicator synergy, visit Investopedia.
Complementary Indicators for SMA
1. RSI: Measuring Overbought and Oversold Conditions
The Relative Strength Index (RSI) is a momentum oscillator that helps determine whether an asset is overbought or oversold.
Overbought (above 70): A potential reversal to the downside.
Oversold (below 30): A potential reversal to the upside.
Why combine RSI with SMA?
If the price is above the SMA and RSI is below 70, the trend is strong.
If RSI is above 70 and the price is extended from SMA, a pullback is likely.
If RSI is below 30 but SMA confirms an uptrend, it may be a buying opportunity.
Learn more about RSI at Babypips.
2. MACD: Confirming Trend Strength
The Moving Average Convergence Divergence (MACD) indicator helps measure trend momentum and strength.
A bullish crossover (MACD line crossing above the signal line) confirms upward momentum.
A bearish crossover (MACD line crossing below the signal line) confirms downward momentum.
How does MACD complement SMA?
If SMA signals an uptrend and MACD shows a bullish crossover, it confirms strong momentum.
If SMA indicates a downtrend and MACD confirms bearish momentum, a short trade is validated.
For more on MACD strategy, check Investopedia.
3. Bollinger Bands: Understanding Volatility
Bollinger Bands measure market volatility and help traders identify price extremes.
Upper Band: Potential resistance (overbought levels).
Lower Band: Potential support (oversold levels).
Middle Band (SMA): Acts as a trend filter.
Why use Bollinger Bands with SMA?
If the price is trending above the middle Bollinger Band (SMA), the trend is bullish.
If price touches the lower band and SMA supports it, a reversal is likely.
Check out a full Bollinger Bands guide at StockCharts.
Example: Combining SMA and RSI for Better Trade Accuracy
Let’s consider a EUR/USD trade setup using 50-SMA and RSI:
Trend Confirmation: The price is above the 50-SMA, signaling an uptrend.
RSI Confirmation: RSI is at 40, meaning the asset is not overbought.
Trade Execution: Buy near the 50-SMA support level when RSI stays above 30.
Exit Strategy: Take profit when RSI reaches 70, indicating overbought conditions.
By combining SMA with RSI, traders avoid chasing overbought conditions and enter at better price levels.

Optimizing SMA Settings for Different Markets
Why Adjust SMA Settings?
The Simple Moving Average (SMA) is a versatile indicator, but using the same settings across different market conditions may lead to inaccurate signals. Optimizing SMA periods based on trading style and market volatility enhances its effectiveness.
For a deeper understanding of SMA strategies, check out Investopedia.
SMA Settings for Different Trading Styles
1. Short-Term Trading: 10-20 Period SMA for Quick Reactions
Short-term traders, such as day traders and scalpers, need fast-moving indicators to capture rapid price changes.
10-SMA or 20-SMA reacts quickly to price action, making it ideal for intraday trading.
The shorter period makes it more responsive to trend changes, reducing lag.
Best used with momentum indicators (e.g., RSI or MACD) to confirm signals.
Example: A trader using a 10-SMA crossover with RSI can spot quick buy/sell opportunities on a 5-minute chart.
For more short-term trading insights, visit Babypips.
2. Medium-Term Trading: 50 Period SMA for Swing Trades
Swing traders hold positions for days or weeks, requiring a balance between speed and reliability.
50-SMA provides strong trend confirmation while filtering short-term price noise.
It acts as dynamic support or resistance, helping traders time entries and exits.
Works well with MACD and Fibonacci retracement levels for trend continuation trades.
Example: If price bounces off the 50-SMA in an uptrend, it signals a potential buy opportunity.
Check out TradingView for swing trading SMA setups.
3. Long-Term Trading: 200 Period SMA for Broader Trends
Long-term traders and investors focus on macro trends, using SMA to identify major market direction.
200-SMA is widely used by institutional traders as a trend filter.
If the price is above 200-SMA, it indicates a bullish long-term trend.
If the price is below 200-SMA, it signals a bearish trend.
Example: The Golden Cross (50-SMA crossing above 200-SMA) is a classic long-term bullish signal.
For long-term trend analysis, check StockCharts.
Adapting SMA to Different Asset Volatility
Why Adjust SMA for Volatile Assets?
Markets with high volatility (e.g., crypto or tech stocks) require faster SMA settings, while stable assets (e.g., bonds) need slower settings to reduce false signals.
For volatile assets: Use a shorter SMA (10-50 periods) to capture sharp price movements.
For low-volatility assets: Use a longer SMA (100-200 periods) to smooth out price action.
Example: In crypto trading, a 20-SMA works better than a 50-SMA due to Bitcoin’s high volatility.
Want to optimize SMA for different assets? Try backtesting your strategy on TradingView.
Final Thoughts
SMA settings should match market conditions and trading goals. Short-term traders prefer fast SMAs, while long-term investors rely on slower SMAs. Adjusting for asset volatility ensures accuracy across different financial instruments.

Real-World Applications and Market Examples
Why Analyze Market Examples?
Understanding how the Simple Moving Average (SMA) performs in different market conditions helps traders improve their strategy. Examining bullish, bearish, and range-bound markets provides insight into SMA’s strengths and weaknesses.
For more market case studies, check Investopedia.
Case Study 1: Using SMA During a Bull Run
How SMA Helps in a Strong Uptrend
During a bullish market, prices consistently move higher, and the SMA acts as dynamic support.
Shorter SMAs (20 or 50 periods) help traders ride the trend.
Pullbacks to the SMA offer buying opportunities.
Golden Cross (50-SMA crossing above 200-SMA) confirms long-term bullish momentum.
Example: S&P 500 Rally (2020-2021)
The 50-SMA acted as a strong support level throughout the uptrend.
Each time the price touched the SMA, it rebounded higher, confirming bullish strength.
Traders who bought near the SMA and held positions made consistent profits.
For more on trend-following strategies, check StockCharts.
Case Study 2: How SMA Responded During a Bear Market
SMA as a Trend Filter in Downtrends
During a bearish market, prices continue to decline, and SMA shifts from support to resistance.
Price below the 200-SMA confirms a long-term downtrend.
50-SMA acts as a short-term resistance, signaling potential sell opportunities.
The Death Cross (50-SMA crossing below 200-SMA) confirms bearish momentum.
Example: Bitcoin Crash (2022)
After peaking in 2021, Bitcoin fell below the 200-SMA, signaling a downtrend.
Each rally toward the 50-SMA was met with selling pressure, confirming resistance.
Traders who followed the SMA trend avoided buying into false recoveries.
For insights on bear market strategies, visit TradingView.
Case Study 3: Challenges in Range-Bound Conditions
SMA Struggles in Sideways Markets
When an asset moves within a range, SMA signals become unreliable due to frequent crossovers.
Short SMAs (10-20 periods) generate false signals in choppy markets.
Price oscillates around the SMA, leading to whipsaws.
Best strategy: Use SMA with Bollinger Bands or RSI to confirm breakouts.
Example: EUR/USD Consolidation (2018-2019)
The pair traded sideways for months, making SMA signals unreliable.
Frequent crossovers resulted in false buy/sell signals.
Traders who combined SMA with RSI or Bollinger Bands identified real breakout opportunities.
For range-trading strategies, visit Babypips.
Key Takeaways
Bullish trends: SMA acts as support; traders buy pullbacks.
Bearish trends: SMA acts as resistance; traders sell rallies.
Range-bound markets: SMA alone is unreliable; combine with other indicators.
Would you like an in-depth guide on avoiding false signals in sideways markets?

Psychology of Using SMA in Trading
Why Trading Psychology Matters?
The Simple Moving Average (SMA) is a powerful technical tool, but a trader’s psychology plays a crucial role in how effectively it’s used. Emotional reactions to false breakouts, sudden deviations, or impatience can lead to costly mistakes.
For insights into trading psychology, visit Investopedia.
Avoiding Overreactions: Handling False Breakouts or Deviations
Why False Signals Occur?
SMA provides trend direction, but false breakouts and price deviations can trigger emotional reactions.
Price can momentarily break the SMA without confirming a trend change.
Whipsaws in range-bound markets create misleading buy/sell signals.
Traders often panic-sell after slight SMA deviations, missing real opportunities.
How to Avoid Emotional Trading?
Use confirmation signals (e.g., RSI, MACD) before acting on SMA breakouts.
Wait for multiple candle closes above/below the SMA before entering a trade.
Set clear stop-loss levels based on volatility rather than emotional reactions.
Example: If price briefly drops below the 50-SMA but RSI remains above 50, it may be a false breakout rather than a trend reversal.
Learn more about handling false signals at StockCharts.
Staying Disciplined: Following SMA-Based Rules Without Emotional Bias
Why Discipline is Key?
Many traders abandon their strategy when faced with small losses, only to re-enter at worse prices.
Fear and greed lead to premature exits or overtrading.
Ignoring SMA rules results in chasing trades and higher losses.
Disciplined traders stick to their SMA-based system regardless of short-term market noise.
How to Stay Committed to SMA Strategy?
Follow predefined entry and exit rules based on SMA crossovers or price action.
Backtest your SMA setup to gain confidence in its effectiveness.
Use a trading journal to review emotional reactions and avoid repeating mistakes.
Example: A trader following a 50-SMA trend strategy should avoid selling too early on minor pullbacks.
For discipline-building techniques, check Babypips.
Final Thoughts
False breakouts are common—use confirmations before reacting.
Stay disciplined—trust your SMA signals and avoid emotional trading.
A strong mindset improves profitability—mastering psychology is as important as technical analysis.

Risk Management and SMA
Why Risk Management Matters?
A well-planned risk management strategy ensures consistent profitability and prevents major losses. The Simple Moving Average (SMA) can act as a guide for setting stop-loss levels, take-profit targets, and trade size adjustments.
For professional risk management techniques, visit Investopedia.
Stop-Loss Strategies: Placing Stops Below/Above SMA Levels
Why Use SMA for Stop-Loss Placement?
Stop-loss orders limit downside risk by automatically closing a position when the market moves against the trade. Placing stops near SMA levels ensures logical exits instead of emotional reactions.
For long trades: Set the stop-loss slightly below the SMA to avoid being shaken out by market noise.
For short trades: Place the stop-loss slightly above the SMA, respecting trend dynamics.
Use volatility filters (e.g., ATR) to avoid placing stops too close to price action.
Example: Using 50-SMA for Stop-Loss
If price is above the 50-SMA, a trader can set a stop 2% below the SMA to allow normal fluctuations.
If price closes below the SMA, it signals a potential trend reversal, triggering the stop-loss.
For more on stop-loss placement, check TradingView.
Take-Profit Strategies: Using SMA as a Trailing Stop Indicator
Why Use SMA for Profit Protection?
A trailing stop-loss follows price movements while locking in gains. SMA can act as a dynamic trailing stop, ensuring profits are secured while allowing for trend continuation.
For long trades: Adjust the stop-loss to follow the SMA as price moves higher.
For short trades: Use the SMA to trail stop-loss downward as price declines.
Combining SMA with Fibonacci levels enhances take-profit accuracy.
Example: 20-SMA as a Trailing Stop in an Uptrend
As price moves higher, a trader can adjust the stop-loss just below the 20-SMA.
If price closes below the 20-SMA, the position is closed, securing profits.
For trailing stop methods, check Babypips.
Trade Size Adjustments: Adapting Based on Risk/Reward Scenarios
Why Adjust Trade Size?
Proper position sizing prevents excessive losses and ensures that risk per trade remains within safe limits.
Higher volatility markets require smaller position sizes to manage risk.
Larger SMA distances mean wider stops, requiring position size reduction.
Risk per trade should not exceed 1-2% of total capital.
Example: Risk/Reward Adjustment Based on SMA Distance
If the 50-SMA is far from the entry price, the stop-loss is wider, requiring a smaller trade size.
If the SMA is closer, a trader can increase position size while maintaining the same risk percentage.
For trade sizing strategies, check MyTradingSkills.
Final Thoughts
Stop-losses should be placed strategically around SMA levels to avoid premature exits.
Using SMA as a trailing stop helps maximize gains while minimizing losses.
Trade size should be adjusted based on SMA distance and market conditions.

Programming the SMA in Trading Platforms
How to Code SMA in Trading Platforms?
Coding the Simple Moving Average (SMA) in trading platforms like TradingView or MetaTrader allows you to visualize and trade using this indicator. Custom scripts can be designed to make the SMA more adaptable and automated.
For a comprehensive guide on coding in Pine Script, check TradingView’s Pine Script Reference.
Basic Example of SMA Coding in TradingView (Pine Script)
Understanding Pine Script for SMA
The Pine Script below calculates and displays a Simple Moving Average (SMA) on the TradingView chart
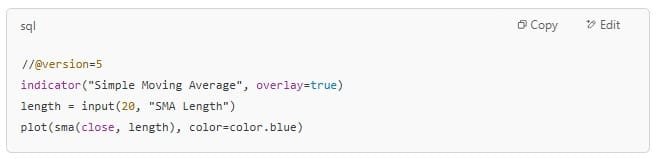
Key Components of the Code
indicator(): Defines the script name and settings.input(): Allows you to set customizable SMA lengths (default is 20).plot(): Plots the SMA line on the chart.
This script uses simple code to plot an SMA line that adjusts based on the length defined in the input() function. You can change the length dynamically to suit different trading strategies.
For more on Pine Script, explore TradingView Pine Script Docs.
Automating SMA-Based Trades: Intro to Automated Systems
Why Automate SMA-Based Trading?
Automating trades based on SMA crossovers can improve consistency and remove emotional bias. Many traders use algorithmic trading systems to enter or exit positions when prices cross specific SMA thresholds.
How to Automate SMA Trades?
TradingView: Use Pine Script to automatically enter buy/sell signals when the price crosses the SMA.
MetaTrader (MQL4/MQL5): Code expert advisors (EAs) to place trades based on SMA conditions.
Example: Code an automatic buy order when the price crosses above the SMA and sell when it crosses below.
For more details on automated trading, visit MetaTrader Programming Guide.
Final Thoughts
SMA can be easily coded on TradingView with Pine Script.
Automating trades based on SMA allows for greater consistency in trading decisions.
Explore TradingView’s Pine Script documentation for more advanced setups.

SMA in Multiple Timeframes
Using SMA to Identify Long-Term Trends
In multiple timeframe analysis, higher timeframes such as daily or weekly charts offer a broader view of market trends. These timeframes are ideal for spotting long-term trends, ensuring that short-term trades align with the overall market direction.
Daily and weekly charts help you spot major trend directions.
The SMA on these timeframes filters out noise and gives a clearer view of market sentiment.
Long-term trends are often stronger and more reliable, helping traders stay on the right side of the market.
For further insight into long-term trend analysis, check Investopedia’s Trend Following.
Short-Term Trade Entries Using SMA on Lower Timeframes
Refining Entry Points with Shorter Timeframes
Lower timeframes such as the hourly or 15-minute charts provide quick trade signals for short-term entries. By using the SMA on lower timeframes, traders can spot price corrections, breakouts, or trend reversals that may not be visible on higher timeframes.
Confirming trends on a higher timeframe (like daily) before taking short-term positions reduces risk.
Shorter timeframes provide more frequent entry points based on SMA crossovers or bounces.
For more on short-term trading strategies, visit BabyPips.
Final Thoughts
Higher timeframes help identify long-term trends, while lower timeframes provide entry opportunities.
Aligning SMA trends across multiple timeframes improves trade accuracy and enhances decision-making.
For better results, combine multi-timeframe analysis with other indicators to confirm trade signals

Conclusion: Mastering Multi-Timeframe SMA for Better Trades
Why Multi-Timeframe SMA Analysis Matters
Using the Simple Moving Average (SMA) across multiple timeframes enhances trend identification and improves trade accuracy. Higher timeframes confirm the overall trend, while lower timeframes pinpoint precise entry and exit opportunities. This approach minimizes false signals and helps traders stay aligned with the broader market movement.
For a deeper understanding of trend confirmation, check Investopedia’s guide to moving averages.
Key Takeaways for Multi-Timeframe SMA Trading
Higher timeframes (daily, weekly) define long-term market direction.
Lower timeframes (hourly, 15-minute) provide entry and exit signals.
Aligning multiple SMAs reduces the risk of false breakouts and improves trade timing.
For optimal trading strategies, visit BabyPips’ Multi-Timeframe Trading.
Final Thoughts: Enhancing Your Trading Strategy
By combining SMA with multi-timeframe analysis, traders can make data-driven decisions and increase their profit potential. This strategy works best when paired with risk management techniques and complementary indicators like RSI or MACD.
Would you like insights on optimizing SMA settings for your trading style?
Terms and Conditions
Educational Purpose
The content provided in this article is intended for informational and educational purposes only. It does not constitute financial, investment, or trading advice.
Learn how the Fourier Transform Indicator detects cycles, reduces noise, and refines trading strategies for market success.